The idea is to spawn a few Docker containers, which will showcase a common monitoring solution for a JVM-based component:
- A Java application container, which will represent the component under observation. It will expose a JMX interface on an arbitrary port.
- A jmxtrans container, which will query the JMX endpoint and push selected metrics over UDP to StatsD.
- A dashboard container, which will contain the StatsD server along with a Graphite and Grafana instance.
Relevant docker-compose configuration:
JVM application
Application under observation needs to enable a JMX endpoint on the process level. This is
reflected in the startup arguments, which are passed to the java command in
application’s Dockerfile:
Please note, that this setup assumes no security on the JMX interface itself. You should provide some kind of firewall when replicating this type of environment in an actual data center.
The app could be anything, since JMX support is built into the JVM, and no
external libraries are required. As long as com.sun.management.jmxremote.* options
are set on the Java process you should be good to go.
For simplicity, our example will generate some noise, but do nothing apart from it:
You can test connectivity using jvisualvm
by replacing the host name value in JMX_HOST with docker-machine ip output, and
connecting it to <ip>:4000.
JMX metric publisher
Application container will be queried by a jmxtrans container, which is defined in a
separate Dockerfile:
All configuration, including metric and endpoint definitions will be set at runtime in the service script. This allows us to rely on environment variables as shown below:
Grafana dashboards
After the environment is spawned using docker-compose up you can start testing
it by creating some dashboards in the Grafana panel.
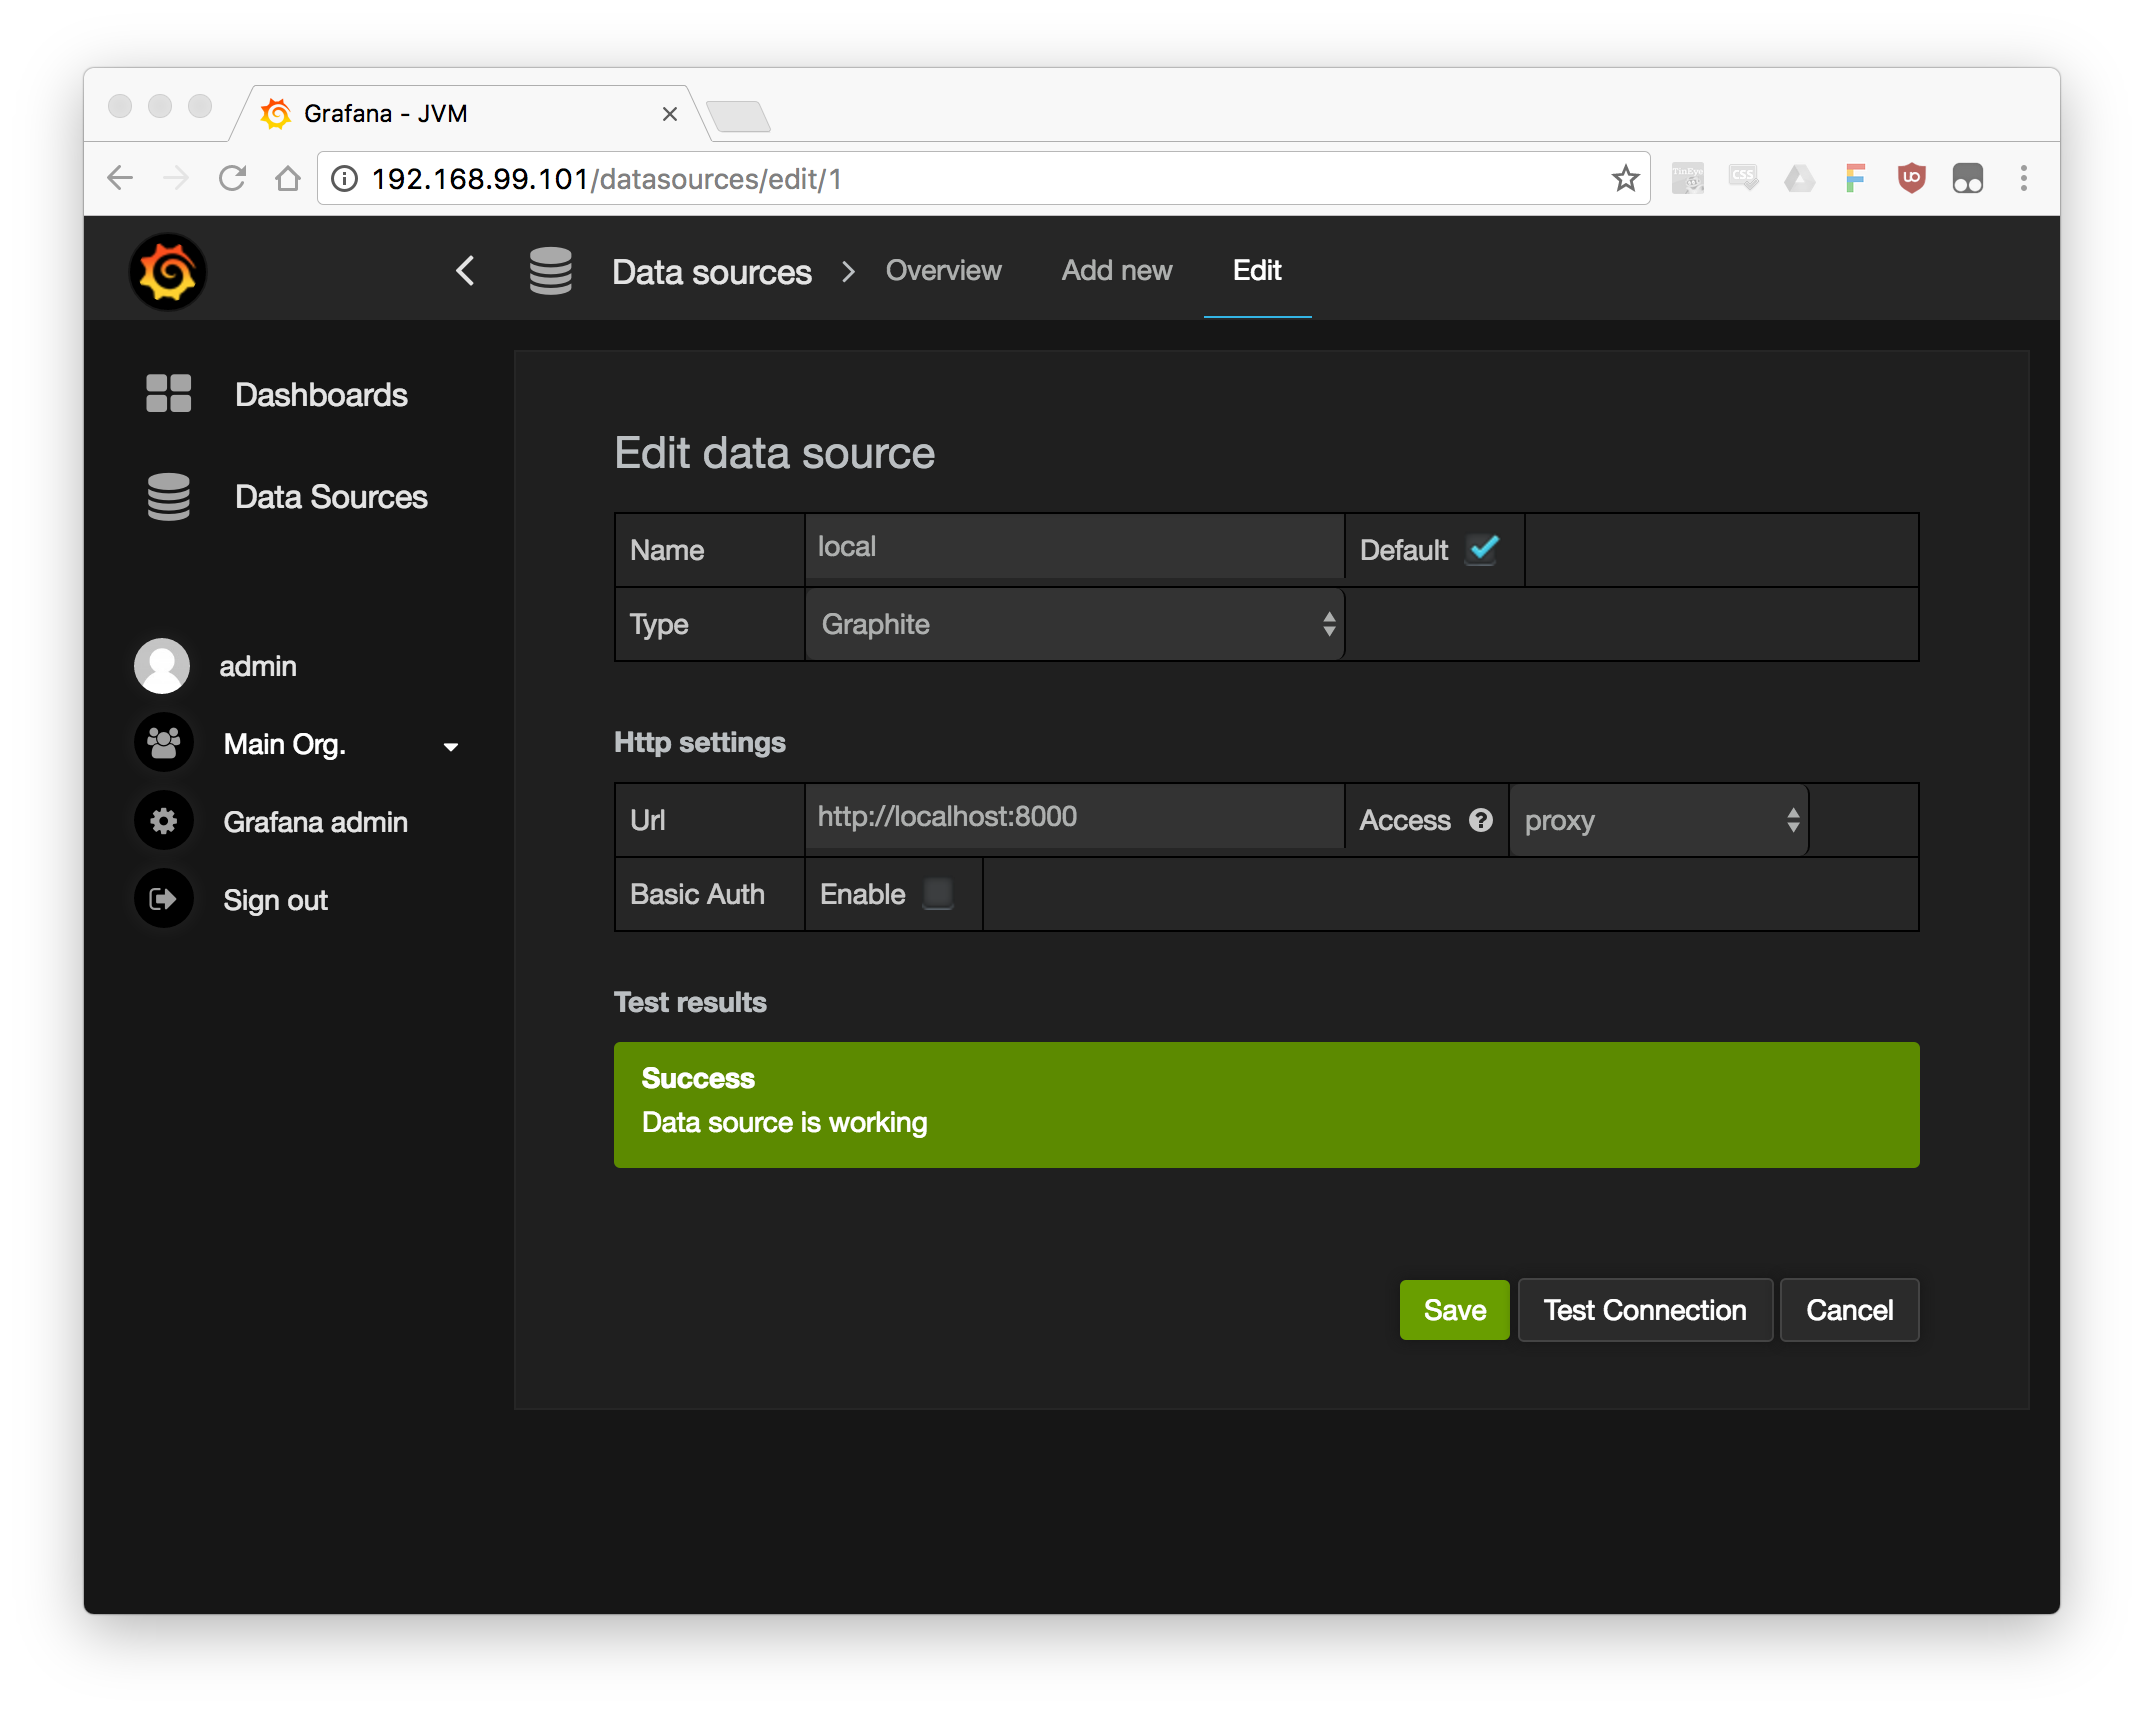
First, you’ll need to login and set up a Graphite data source as described here:
You should be able to define metrics using the stats.counters.servers tree as shown below:
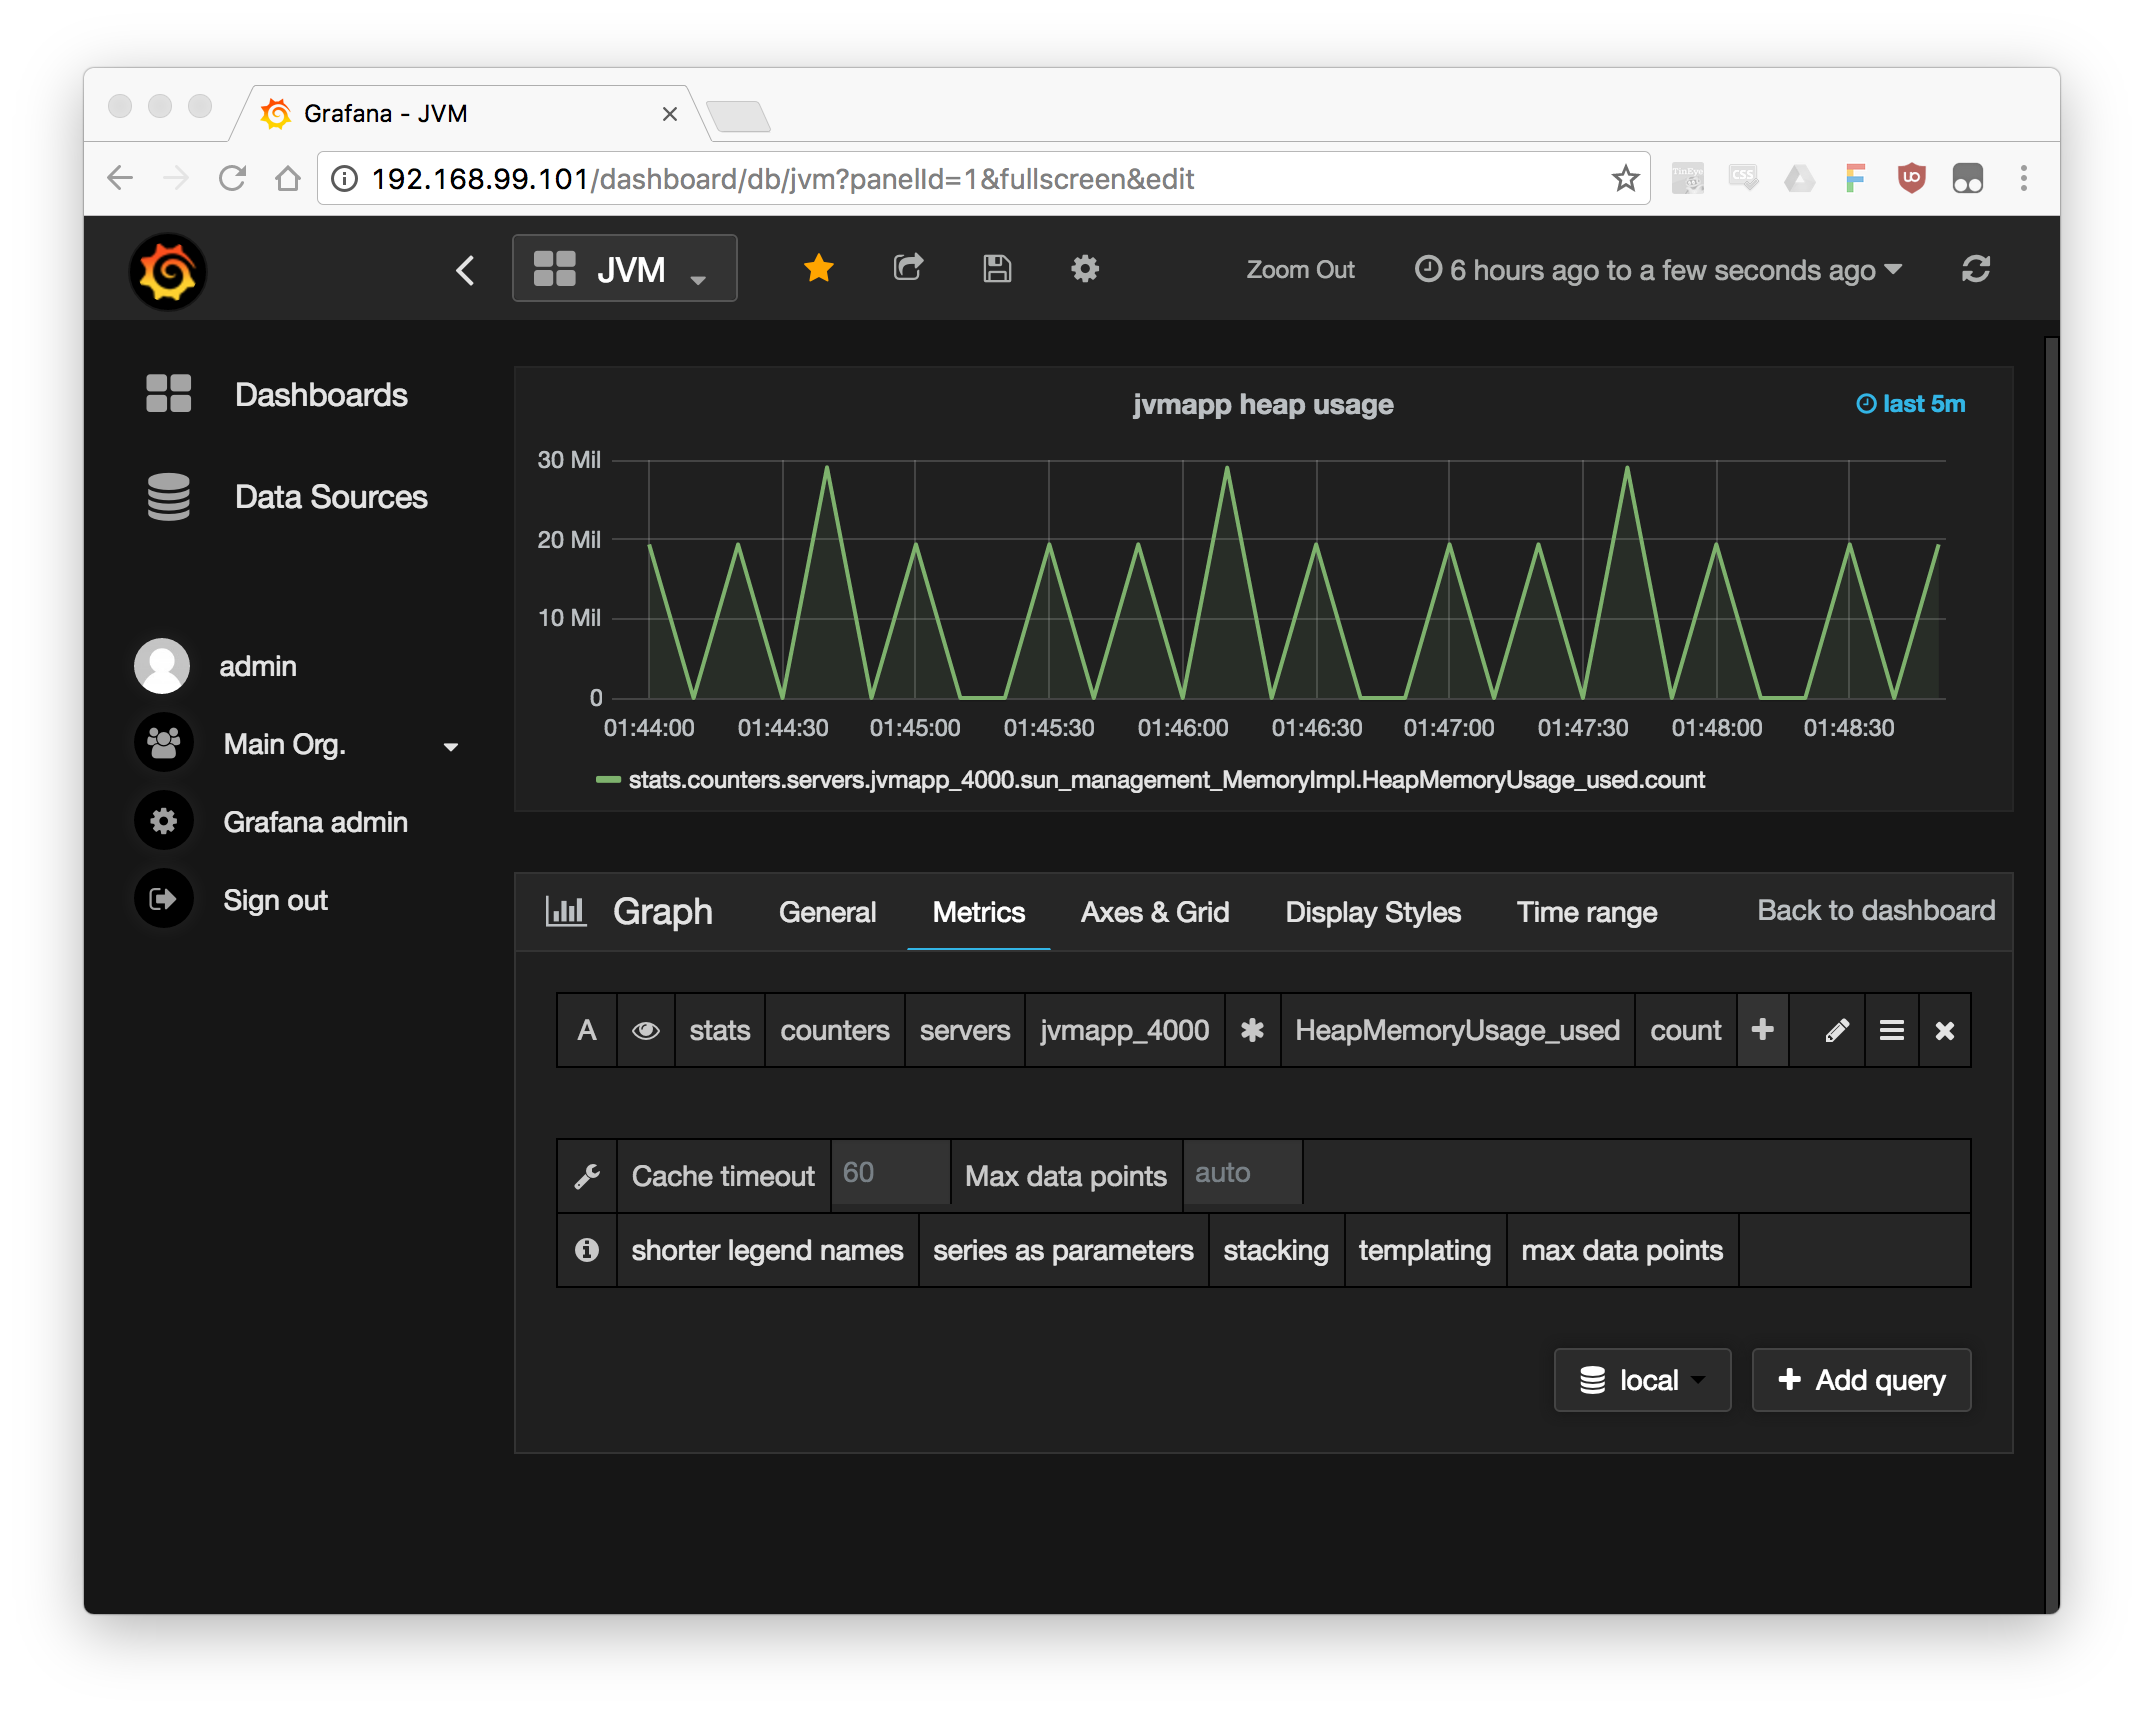
Don’t forget to add an aggregation function at the far end of your metric string
definition. Adjusting the Time Range should also help with improving the visibility
of the data.
Conclusions
I hope this minimal example will help you to get started with JVM monitoring in a Docker environment. You can find the complete source code here, if you would like to experiment with it yourself.